Beyond Dashboards: Using Behavioral Predictive Modeling to Drive E-commerce Conversion
Most analytics teams report what happened. I built a system that predicts what will happen next — and identifies which visitors are worth targeting before they leave.
The Challenge: Data is Everywhere, but Intent is Hidden
Most e-commerce businesses look at Google Analytics 4 (GA4) with a focus on what happened: How many sessions? What is the bounce rate? What is the conversion rate?
While these metrics are important for reporting, they are reactive. As a data scientist with a background in statistical modeling, I believe the real value lies in being proactive — identifying a visitor’s intent while the session is still active to trigger the right intervention at the right time.
This post walks through a complete analytical pipeline I built on a high-fidelity synthetic GA4 dataset representing 25,000 sessions from a fashion e-commerce store. The pipeline includes:
- Exploratory data analysis
- Two-model propensity scoring architecture
- K-Means behavioral segmentation
- Segment-specific business recommendations
The Dataset: Synthetic but Realistic
Unlike toy datasets, this one includes granular behavioral signals that mirror real GA4 event streams:
| Feature Group | Variables |
|---|---|
| Engagement | Scroll depth, session duration, pages viewed |
| Product Interaction | Product views, wishlist adds, site search, promo clicks |
| Funnel Progression | Add-to-cart, checkout steps reached |
| Context | Device, traffic source, country, hour, day of week |
Baseline conversion rate: 7.39%
Predictive Modeling: Two-Model Architecture
I trained two distinct Random Forest models to predict the likelihood of conversion. The reason for two models — not one — is deliberate and strategically important.
Model A: Full-Session Propensity
This model uses all available behavioral signals, including late-funnel variables such as add_to_cart and checkout_step_reached.
Purpose: Operational scoring — rank all sessions by conversion probability for post-session remarketing, email targeting, and audience creation.
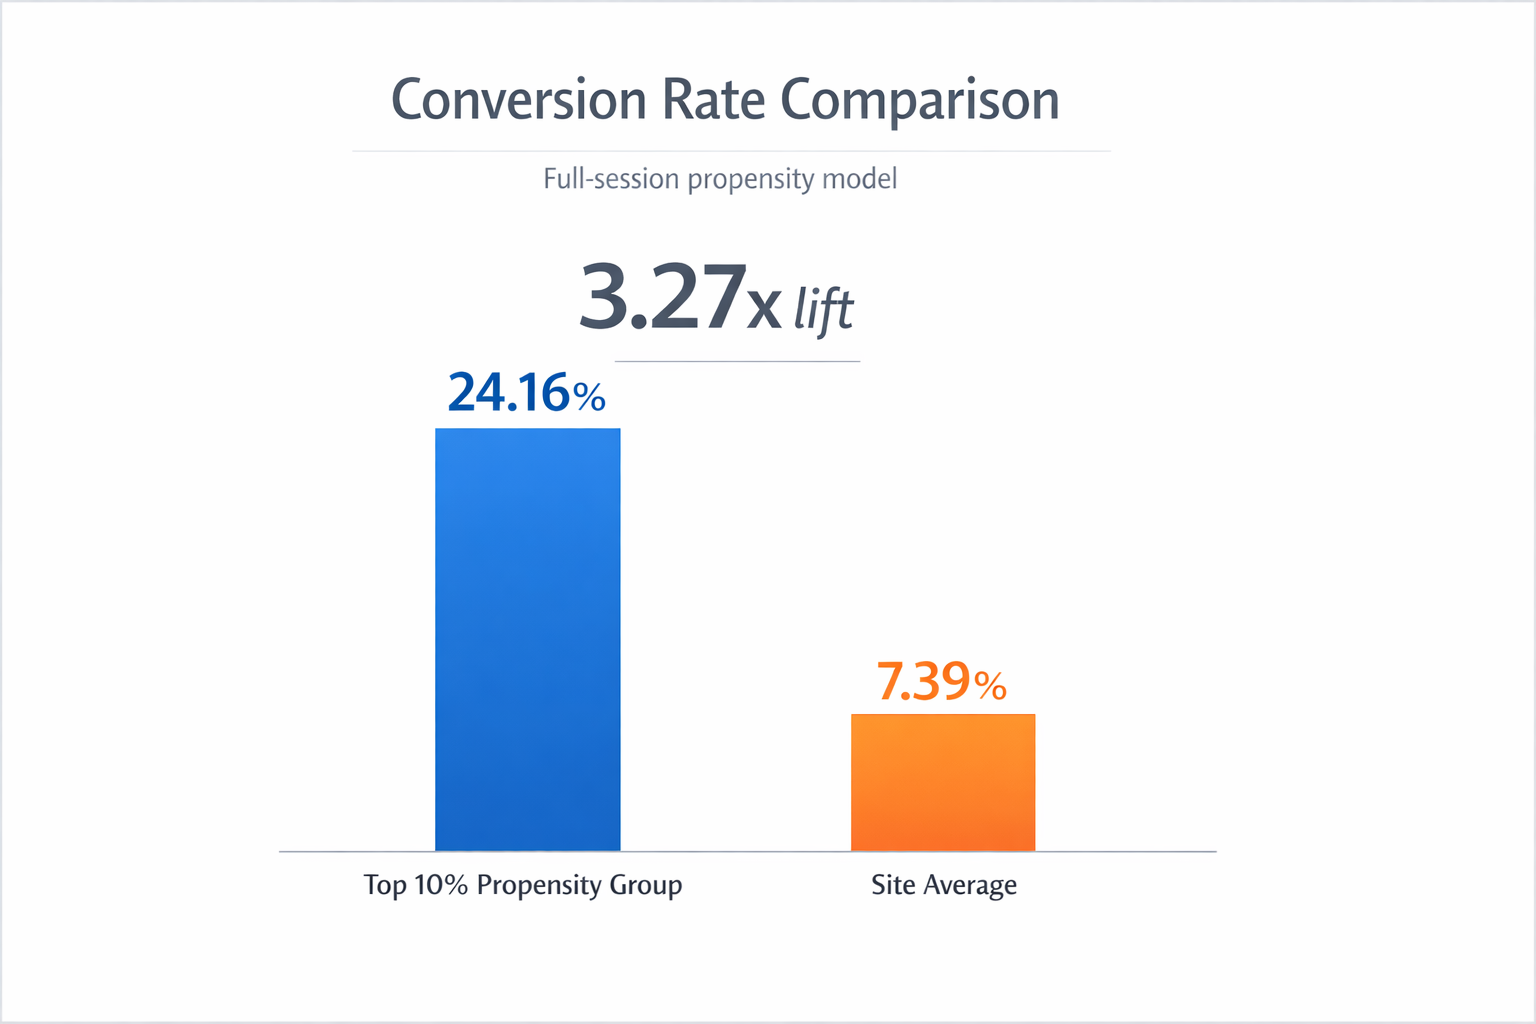 Figure 1: The top 10% of sessions ranked by propensity score converted at 24.16% — a 3.27x lift over the 7.39% site average.
Key results:
| Metric | Value |
|---|---|
| ROC-AUC | 0.8721 |
| Average Precision | 0.5634 |
| Top 10% Conversion Rate | 24.16% |
| Top 10% Lift | 3.27x |
| Top 20% Lift | 2.68x |
Top predictive features:
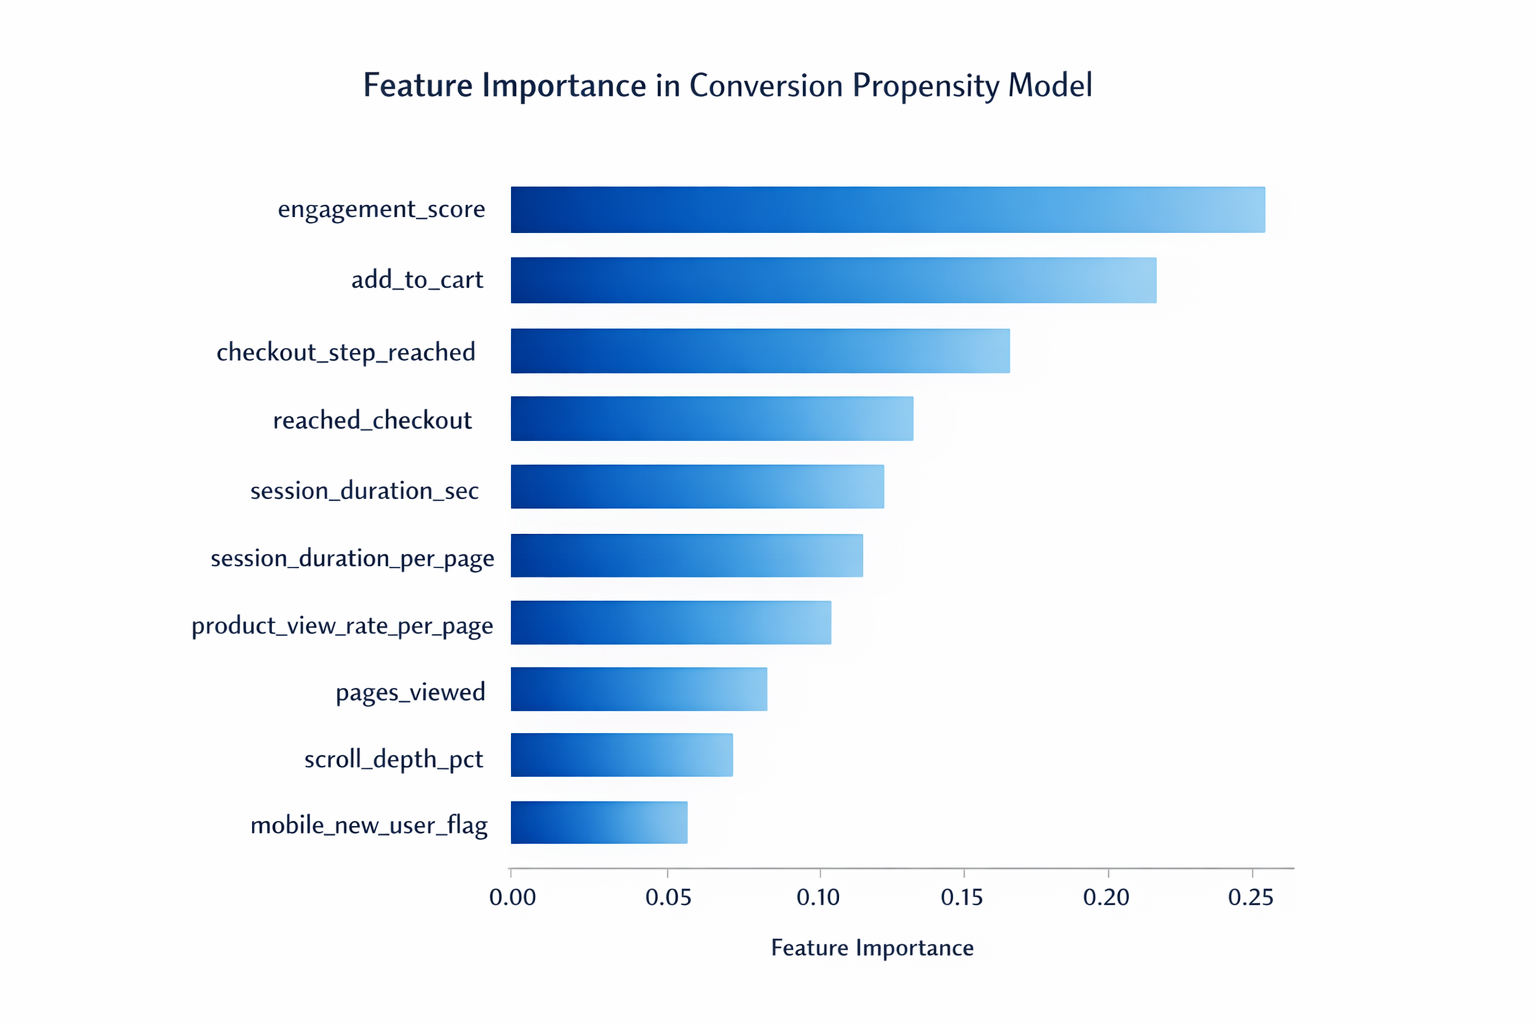 Figure 2: Engagement score, add-to-cart behavior, and checkout progression dominate feature importance — confirming that funnel depth is the strongest conversion signal.
Model B: Pre-Checkout Propensity (The Strategic Model)
To enable earlier intervention — before a user adds to cart or reaches checkout — I built a second model that deliberately excludes all late-funnel signals:
Excluded variables: add_to_cart, reached_checkout, checkout_step_reached, checkout_progress_ratio
Purpose: Real-time personalization, smart popup triggering, promo eligibility scoring, and PDP optimization — all triggered before the user signals explicit purchase intent.
Key results:
| Metric | Value |
|---|---|
| ROC-AUC | 0.5812 |
| Average Precision | 0.0998 |
| Top 10% Conversion Rate | 11.84% |
| Top 10% Lift | 1.60x |
| Top 20% Lift | 1.48x |
The drop in predictive power compared to Model A is expected and honest. When late-funnel variables are removed, the model has less information. But it still identifies a top-decile audience converting at 1.60x the baseline using only pre-checkout behavior — which is commercially actionable.
“When late-funnel variables were removed, the model’s predictive power dropped as expected — but it still identified a top-decile audience converting at 1.6x the baseline rate using only pre-checkout behavior.”
Top pre-checkout signals:
engagement_score_precheckoutsession_duration_secproduct_view_rate_per_pagesession_duration_per_pageproduct_viewshourscroll_depth_pct
Behavioral Segmentation: One Size Does Not Fit All
Using K-Means clustering (k=6, selected by silhouette score), I identified six distinct visitor segments based purely on behavioral features — without using the conversion label.
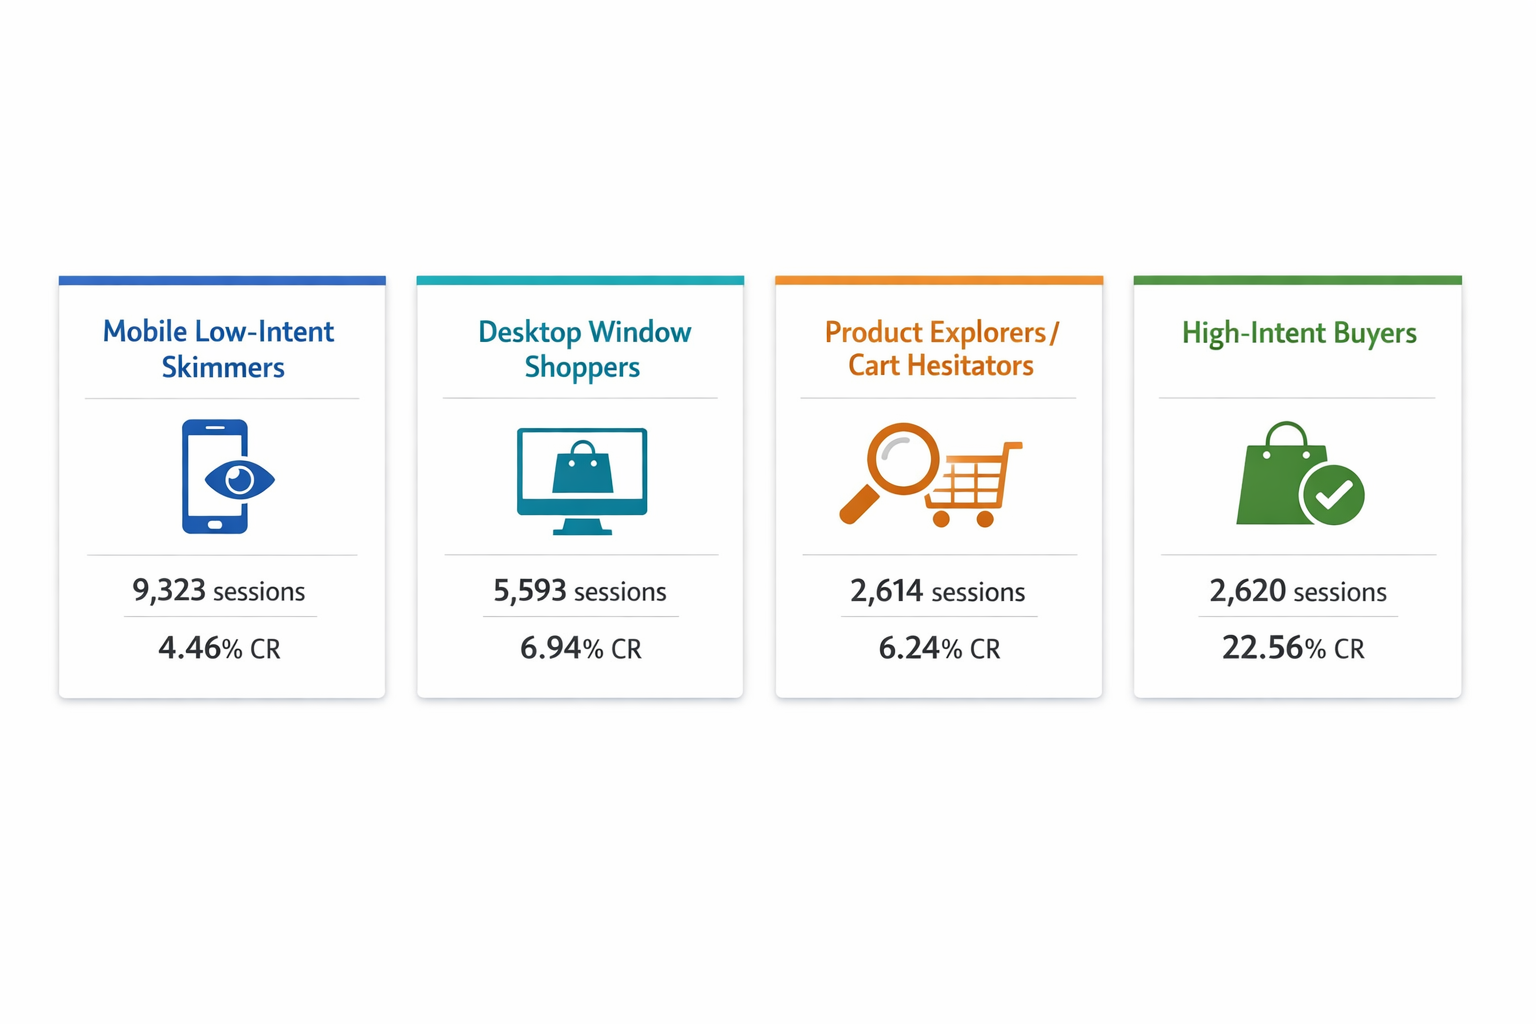 Figure 3: Four key segments with distinct behavioral profiles and conversion rates. Each segment requires a different intervention strategy.
The key insight: not all non-converting sessions are the same.
Segment Profiles and Recommended Actions
1. Mobile Low-Intent Skimmers
- Sessions: 9,323 (37% of traffic)
- Conversion Rate: 4.46%
- Mobile share: 91%
- Behavior: Low product interaction, short sessions, minimal scroll depth
This is the largest segment and the weakest converter. The primary opportunity is not acquiring more traffic — it is reducing mobile friction.
Recommended actions:
- Simplify mobile landing pages
- Improve page load speed
- Add sticky CTAs and trust badges
- Test first-session micro-incentives
2. Desktop Window Shoppers
- Sessions: 5,593
- Conversion Rate: 6.94%
- Behavior: Moderate engagement, desktop-dominant, no strong purchase signal
Recommended actions:
- Browse abandonment email sequences
- Recently viewed products widget
- Wishlist nudges
3. Search-Driven Browsers
- Sessions: 3,236
- Conversion Rate: 6.03%
used_search = 1.00(all users in this segment used site search)- Behavior: Clear intent, but not converting
These users know what they want but may not be finding it fast enough.
Recommended actions:
- Onsite search UX audit
- Autocomplete and synonym tolerance
- No-results page optimization
- Filter and facet improvements
4. Product Explorers / Cart Hesitators
- Sessions: 2,614
- Conversion Rate: 6.24%
product_views: 4.26 averageadd_to_cart: 0.30reached_checkout: 0.01
High product interest, low checkout progression. This is a high-value friction point.
Recommended actions:
- Cart abandonment recovery
- Shipping threshold communication
- Exit-intent offers
- Mini-cart UX improvements
5. High-Intent Buyers
- Sessions: 2,620
- Conversion Rate: 22.56%
- Revenue per session: $33.23
add_to_cart: 1.00,reached_checkout: 1.00
The goal here is not persuasion — it is zero friction.
Recommended actions:
- Streamline checkout to minimum steps
- Optimize payment UX
- Surface upsell and bundle offers
- Prioritize checkout abandonment recovery
The Predictive Growth Engine: End-to-End Architecture
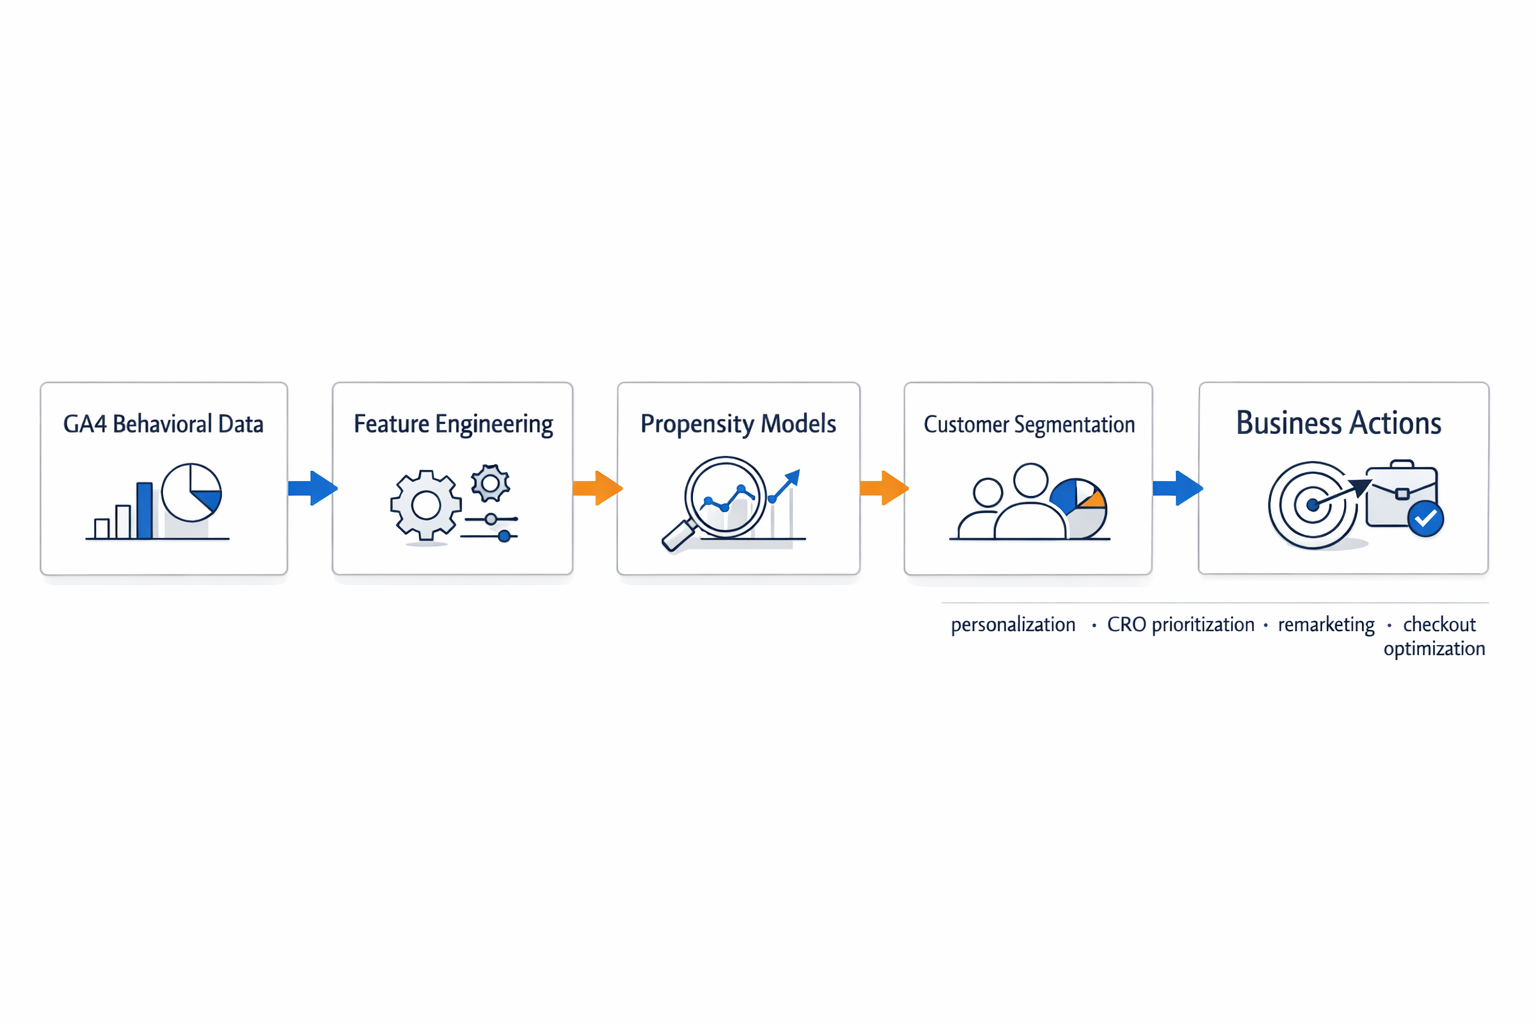 Figure 4: The full pipeline — from raw GA4 behavioral data through feature engineering, dual propensity models, and segmentation — to segment-specific business actions.
The architecture connects five layers:
- GA4 Behavioral Data → raw event stream
- Feature Engineering → session-level aggregation, engagement scoring, device/time flags
- Propensity Models → full-session (operational) + pre-checkout (real-time)
- Segmentation → K-Means behavioral clusters
- Business Actions → personalization, CRO prioritization, remarketing, checkout optimization
From Insights to Revenue: The Business Case
By targeting the top 20% of high-intent sessions identified by the model with a personalized intervention — a time-sensitive offer, dynamic social proof, or a smart nudge — a conservative 12% relative lift in their conversion rate generates meaningful incremental revenue.
In this 25,000-session sample:
| Metric | Value |
|---|---|
| Top 20% audience size | 1,250 sessions |
| Observed conversions in top 20% | 137 |
| Extra conversions at +12% lift | ~16 |
| Average Order Value | $143.53 |
| Estimated incremental revenue | ~$2,300 |
At production scale — 500,000 sessions/month — this translates to $46,000+ in incremental monthly revenue from a single model-driven intervention.
Summary: Data Science as a Growth Engine
Modeling conversion is not just about the AUC score. It is about resource allocation.
By knowing which sessions have the highest probability of conversion, businesses can:
- Optimize ad spend toward high-intent audiences
- Trigger onsite personalization only when it is statistically likely to work
- Prioritize UX improvements based on segment-specific friction points
- Reduce wasted retargeting budget on low-intent visitors
“Segmentation showed that not all non-converting sessions were the same. Some users were low-intent mobile skimmers, others were search-driven evaluators, and another group displayed strong product interest without progressing to checkout. This suggests that conversion optimization should be segment-specific rather than one-size-fits-all.”
The combination of a two-model propensity architecture with behavioral segmentation gives businesses a framework that is both statistically rigorous and operationally actionable — which is exactly where data science creates the most value.
What’s Next
In the next post, I will connect this pipeline to a real GA4 property using BigQuery export, build the feature engineering layer in Python, and demonstrate how to score live sessions in near real-time.
If you are working on a similar problem or want to discuss how this approach could apply to your business, I would be happy to connect.